- In this article, we learn about basic things in Power BI that is Include and Exclude.
INCLUDE AND EXCLUDE
- When we create a visualization and exploring data sometimes we focus on specific data. Also, we want to remove a specific point because we don’t want to focus on them.
- Now, we can select one or more points and right-clicks to include or exclude points in your visual.
- Exclude will filter out the points you’ve chosen to exclude.

- In this dashboard, I want to remove the Kolhapur and only focus on Mumbai and Delhi.
- First, select the visualization component and right-click on Kolhapur data and click on the Exclude option.

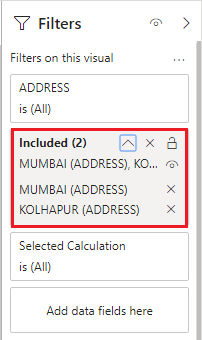
- In the Filter, we can see how many points we excluded or included.

- Also, the changes will apply to the visualization component. We can see the below dashboard.

- If we want to remove excluded data then go to filter and click the crossbar.

- Include will filter out all points except for those you have chosen to include.
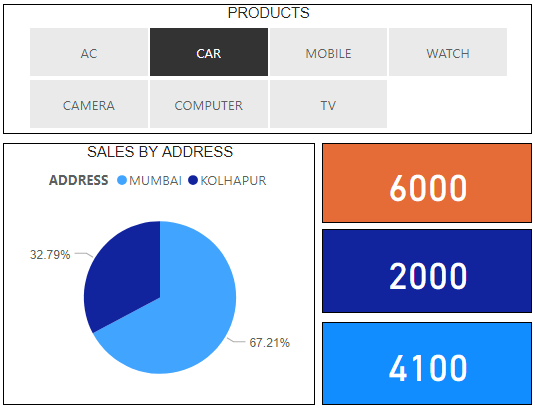
- If we want to a display selected point then it is done by include. Here we display only Kolhapur and Mumbai data.
- In the visualization component, select Kolhapur and Mumbai data by using Ctrl + Click then right-click on it and also click on the include option.

- Included data we can see in the Filter. The filter has information about include and exclude.
- Here filter shows two records that are Mumbai and Kolhapur which is we are selected when applying the include option.
- Subsequently, changes are happening in the visualization.
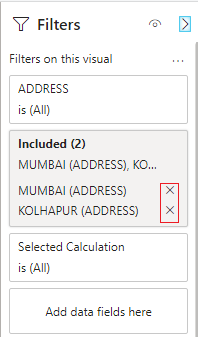
- In the filter, we can delete the include data.
If you are new to Power BI start with the following must-watch video:-